Vancouver Property Intelligence
Every Vancouver address, turned into a full intelligence brief.
Zonevix grounds every analysis in real BC Assessment data, live zoning bylaws, city permits, and 20+ Vancouver Open Data sources — not estimates. Get fair value, redevelopment upside, policy momentum, liveability, and a plain-English AI summary in under a minute.
Real data. No estimates. No fabricated numbers.
The problem
Listing data doesn't tell you what a property actually is.
Asking price says nothing about what a lot is worth — or what it could become.
Zoning bylaws, CD-1 numbers, DCL rates, and subdivision rules are buried across a dozen City of Vancouver PDFs and datasets.
BC Assessment values and five-year trends live on a site designed for tax appeals, not investment decisions.
Policy momentum — permits nearby, council votes, business licence shifts — is real signal, but nobody has time to track it manually.
Every property platform shows listings. Almost none show what the lot could actually do under current bylaws.
The solution
See the property behind the listing.
Fair value grounded in BC Assessment history, comparable sales, and lot-specific context — with a confidence score.
Current build potential: zoning code, FSR capacity, max units, multiplex eligibility, subdivision rules, and TOD overlays.
Policy momentum within 500m: permits, city projects, council votes, business licence deltas — all from live Vancouver Open Data.
Plain-English AI summary, scenario analysis, and next-step recommendations you can paste into a client email.
Features
Every layer of intelligence, grounded in real data.
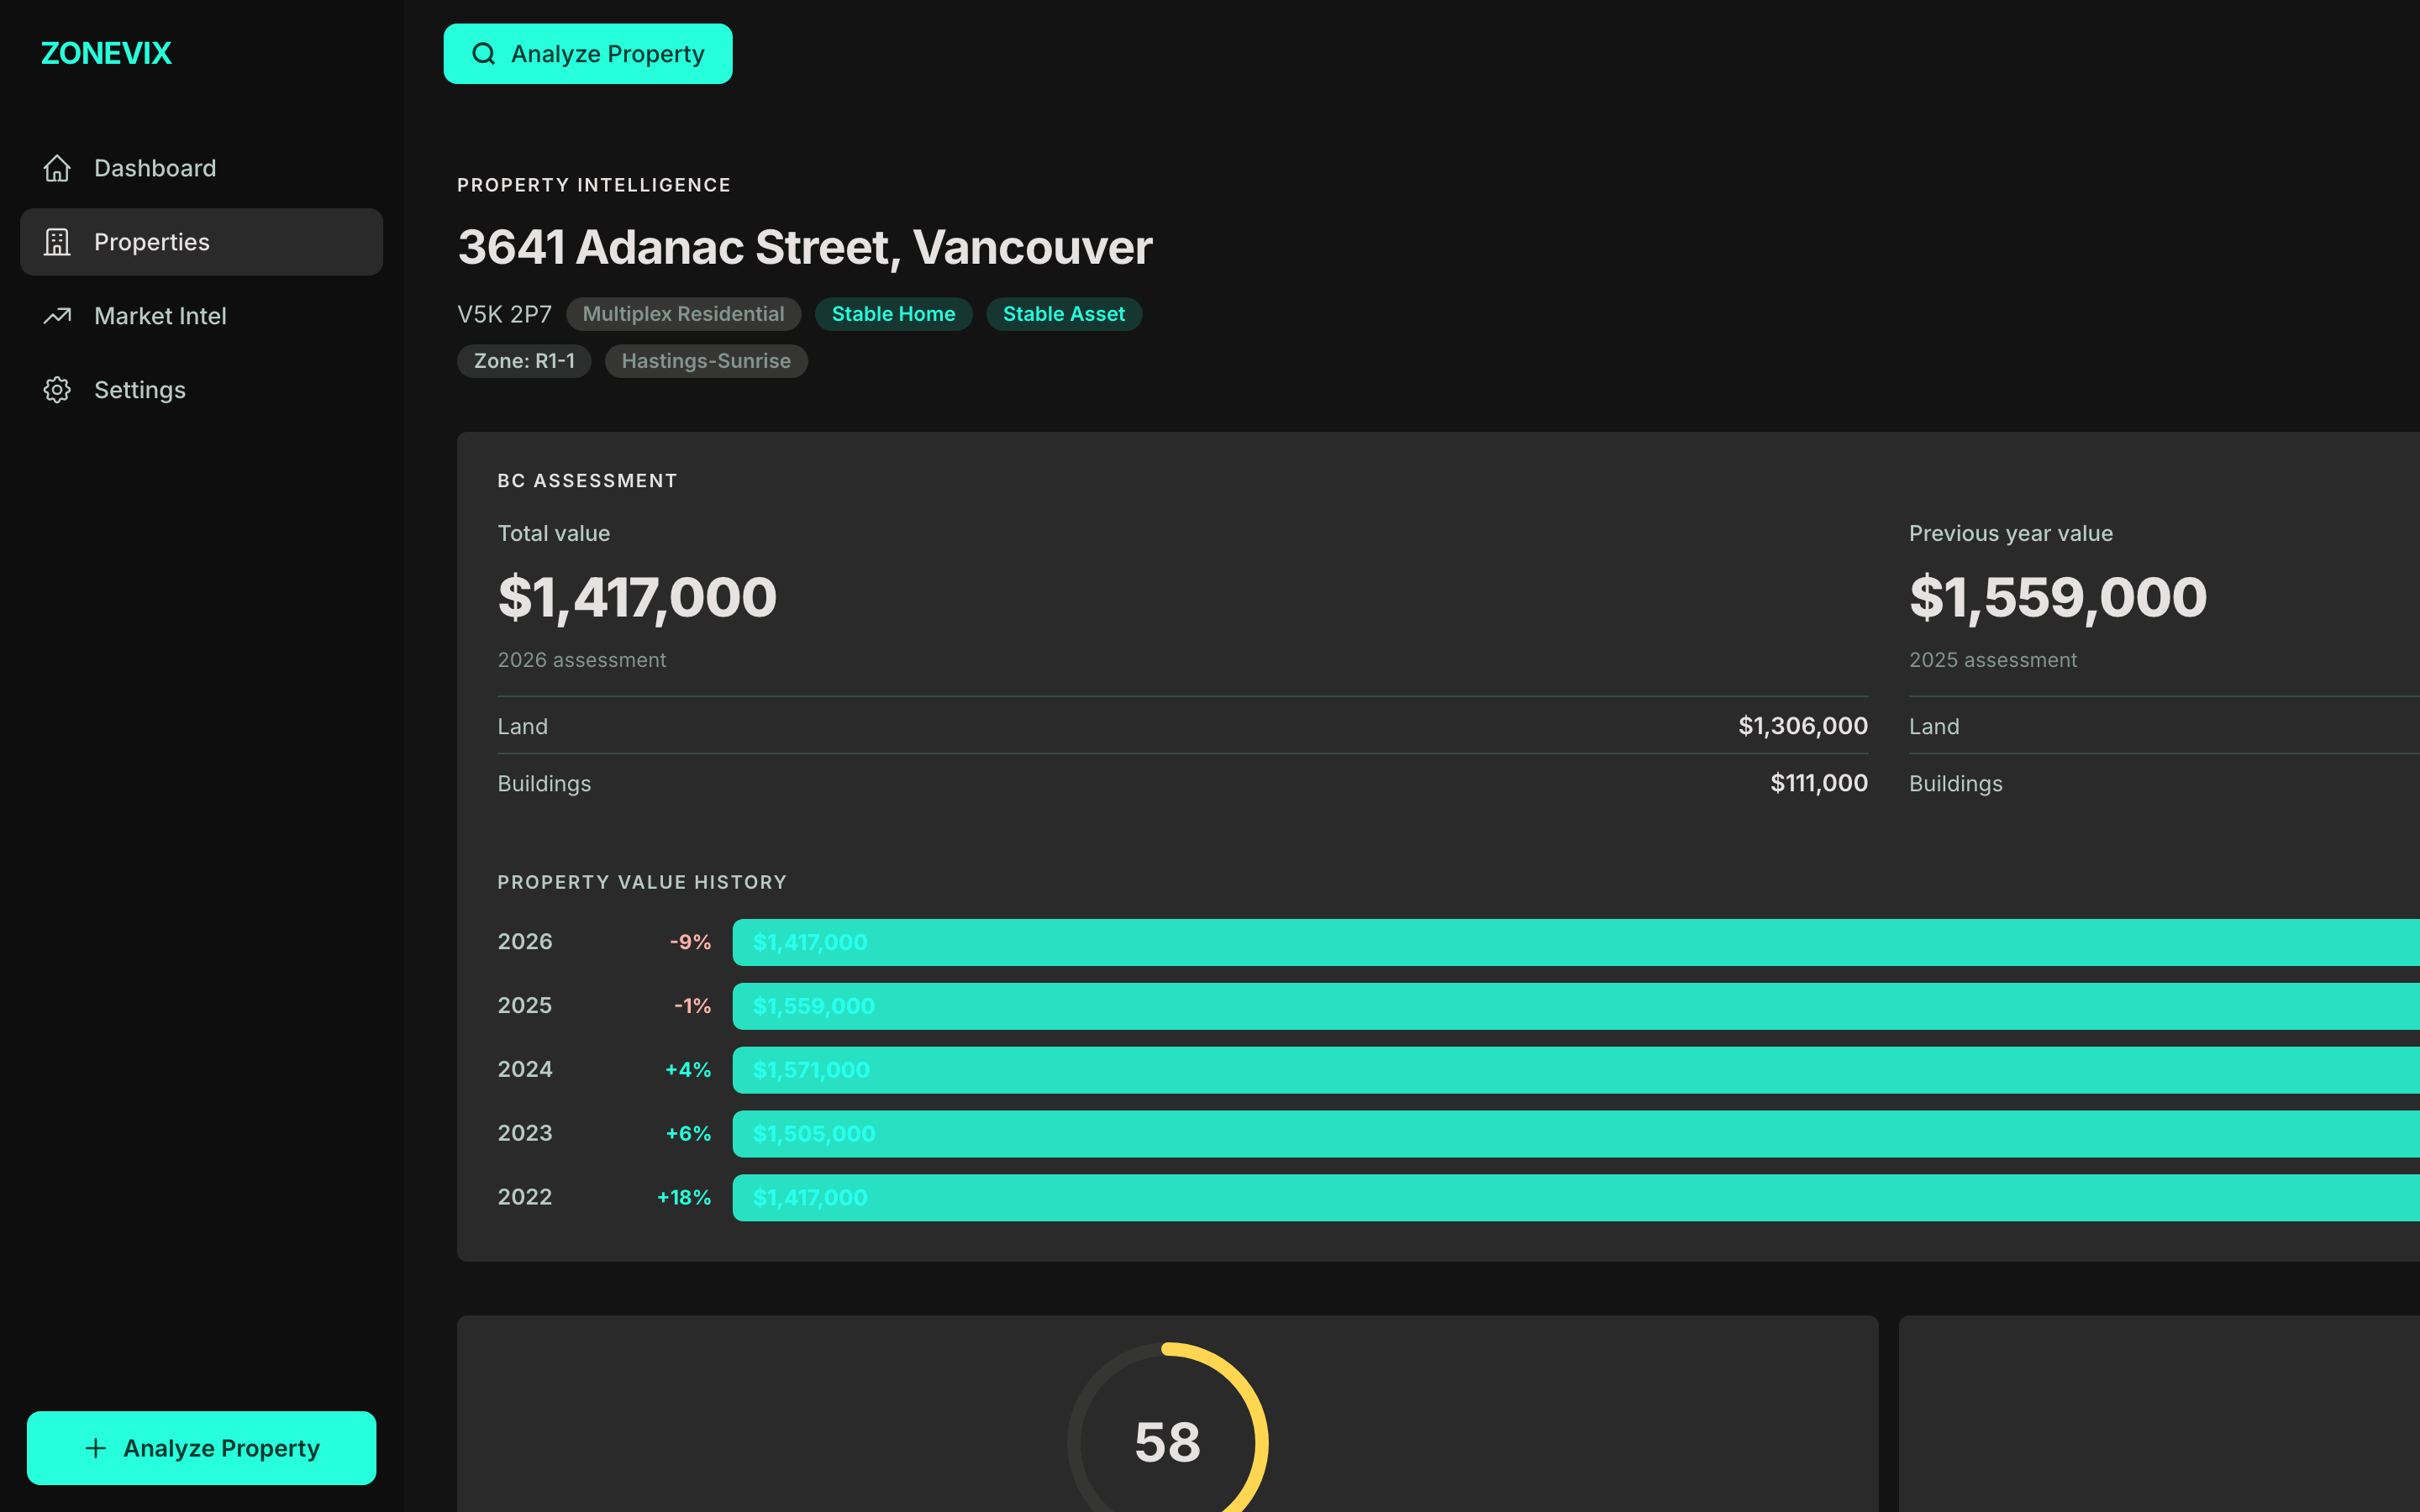
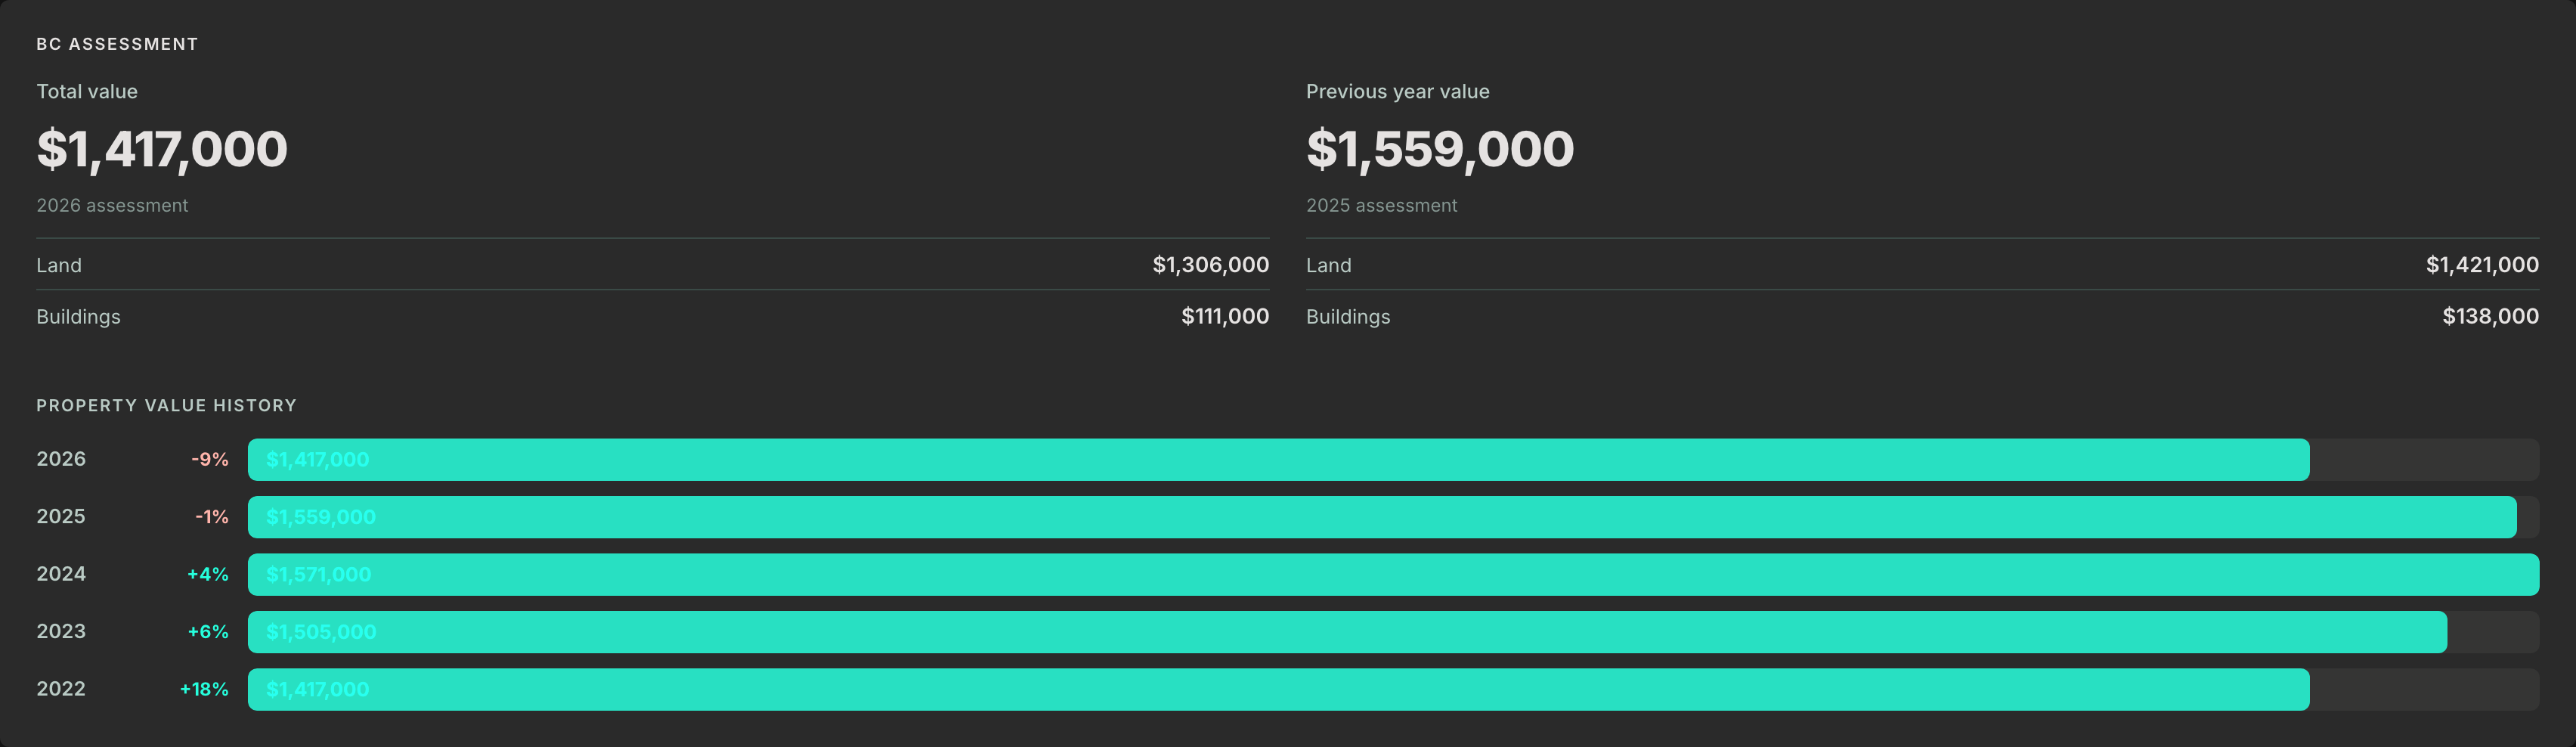
BC Assessment, rebuilt for investors
The tax authority's own numbers, in a layout that actually helps you decide. Total value, year-over-year deltas, land-to-improvement split, and a 5-year property value history chart — all pulled live from the City of Vancouver Open Data.
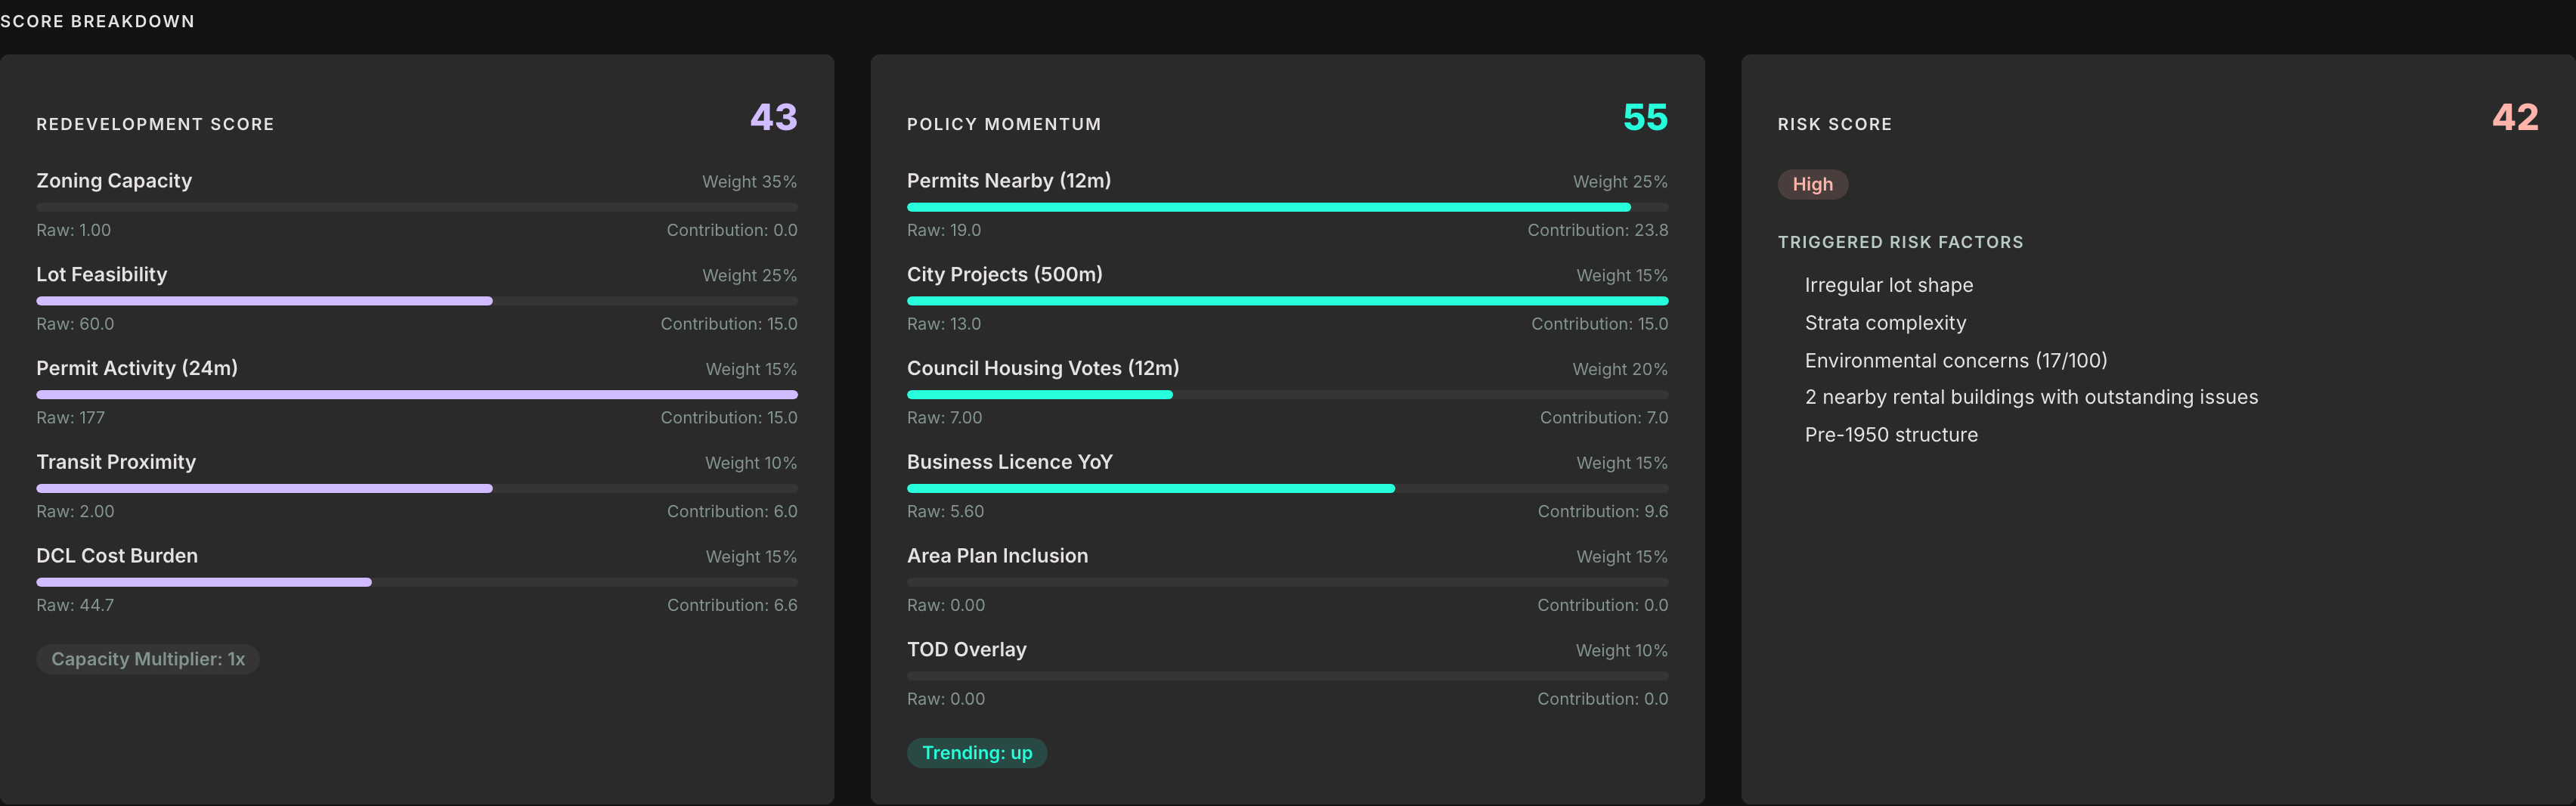
Four-score breakdown
Deal Score, Redevelopment Score, Policy Momentum, and Risk — each with a transparent breakdown of every contributing factor and its weight. No black box. Every number traces back to a real dataset.
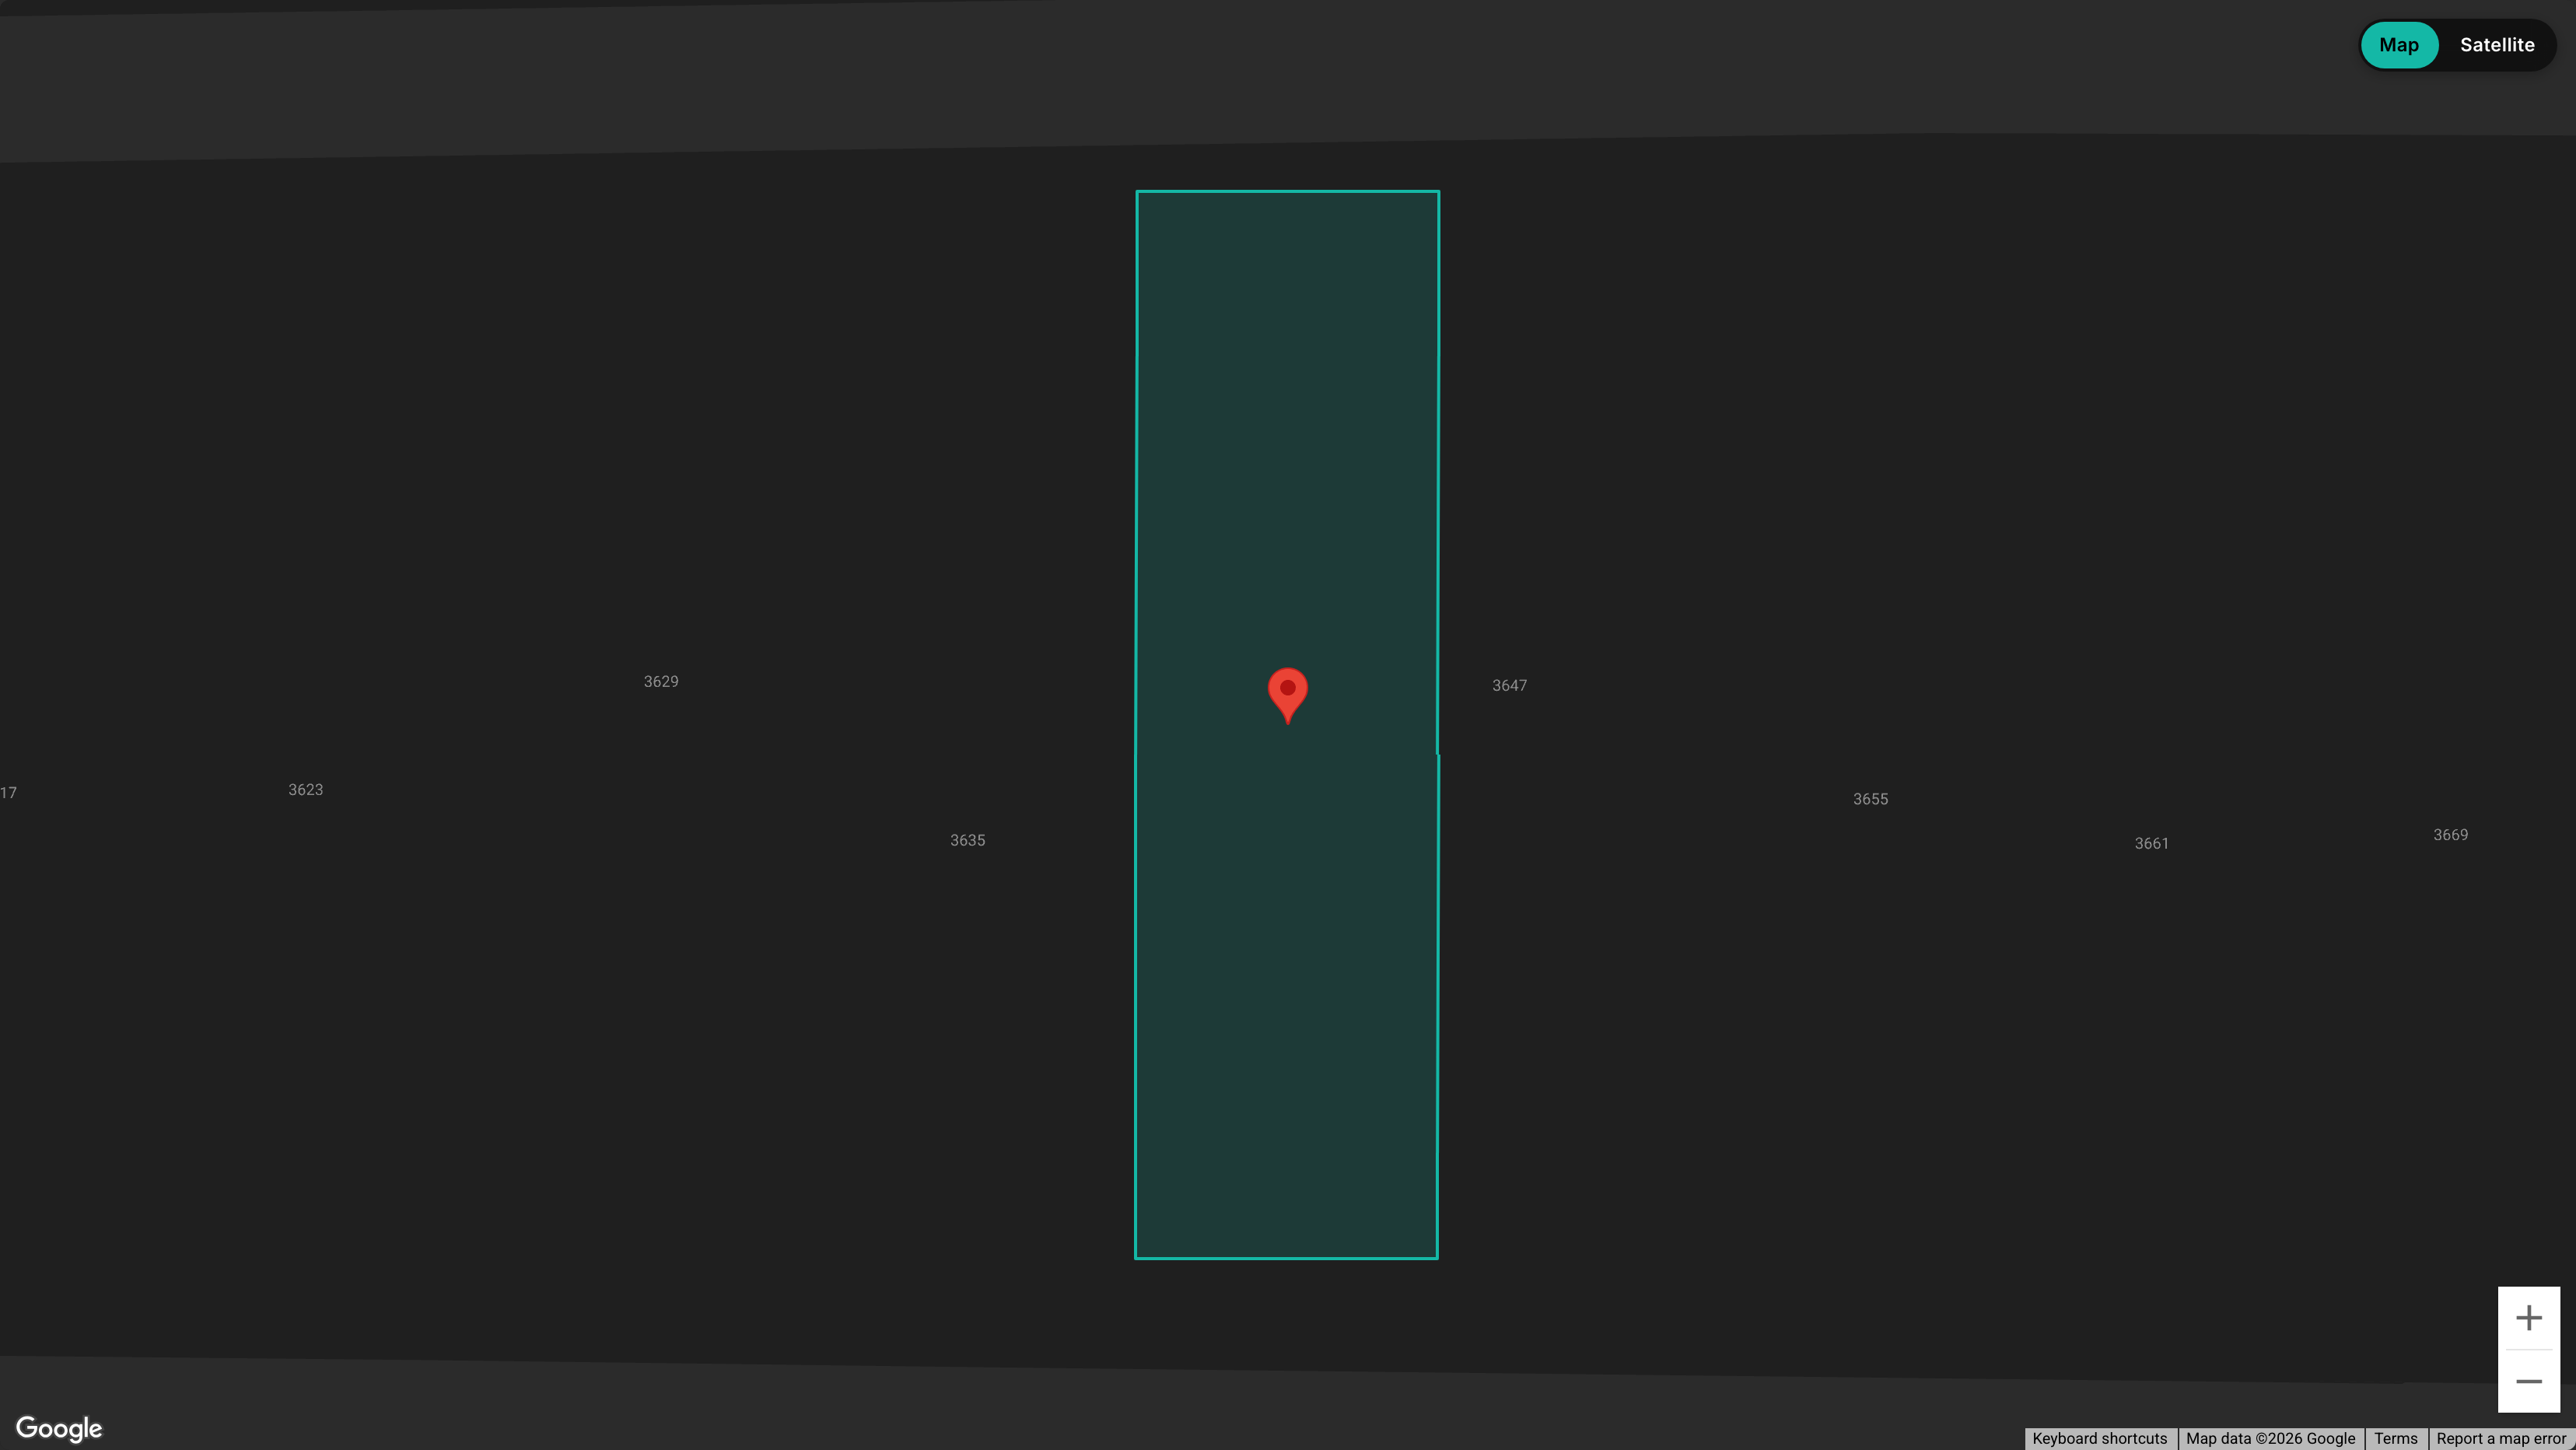
Real parcel geometry & satellite
Interactive Google Maps with the actual parcel polygon overlaid from Vancouver's property-parcel-polygons dataset. Switch between map and satellite with one tap. Building footprints are always current.
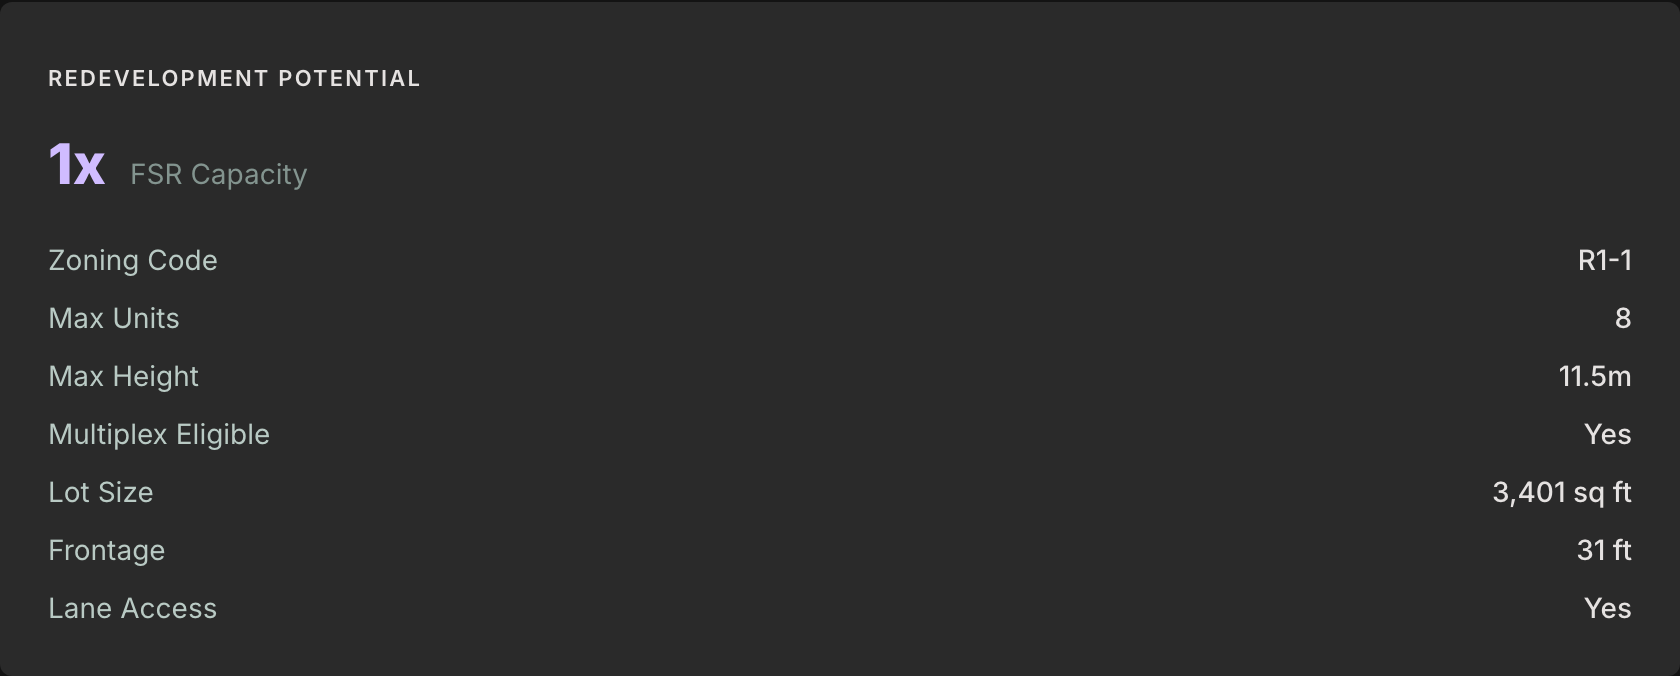
Redevelopment potential
See FSR capacity, max units, max height, multiplex eligibility, subdivision rules, and DCL rates straight from the Vancouver Zoning Bylaw — not a generic estimate. Know exactly what the lot can become under current regulations.
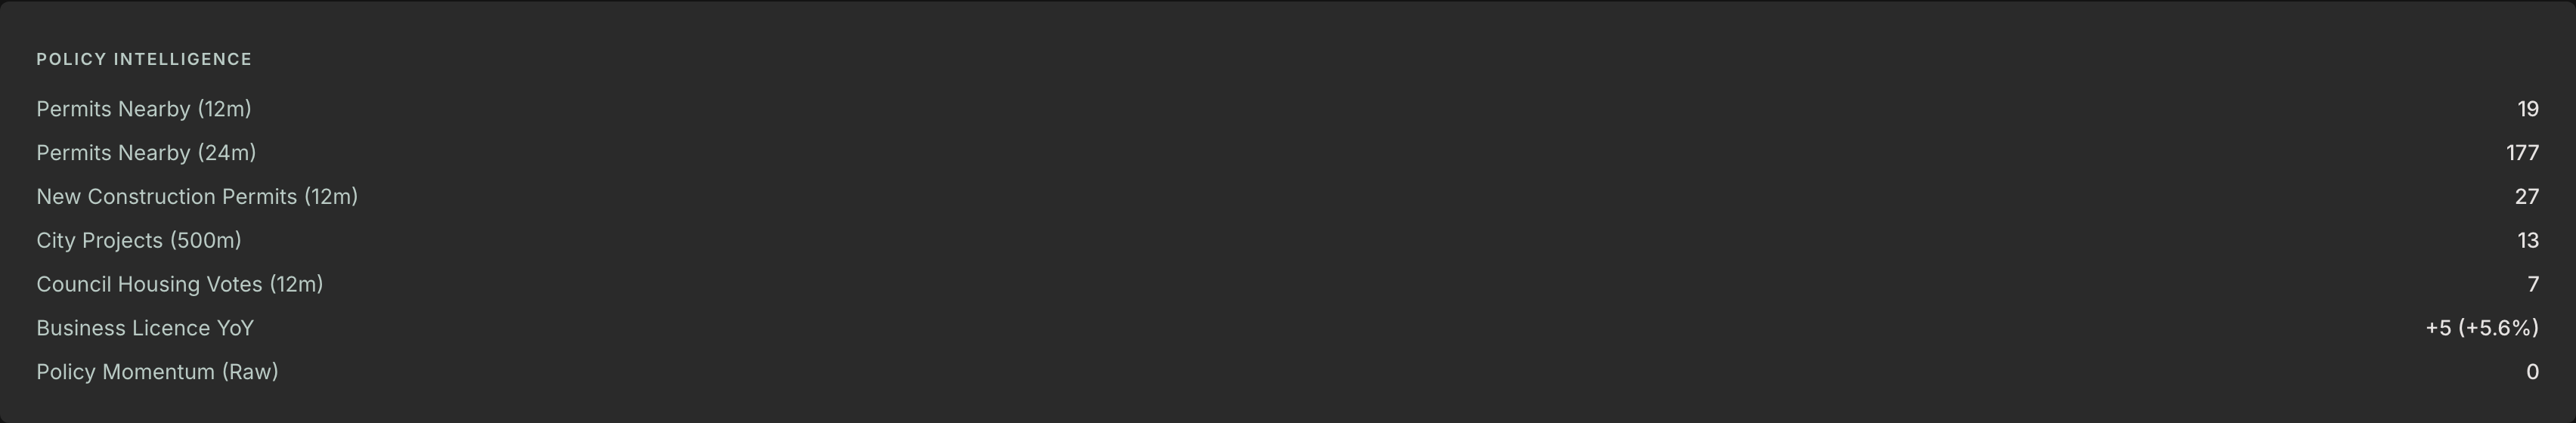
Policy momentum signals
Permits issued within 500m over the last 12 and 24 months. City project activity. Council housing votes. Business licence year-over-year change. All computed from live Vancouver Open Data — no hand-curated lists, no invented multipliers.
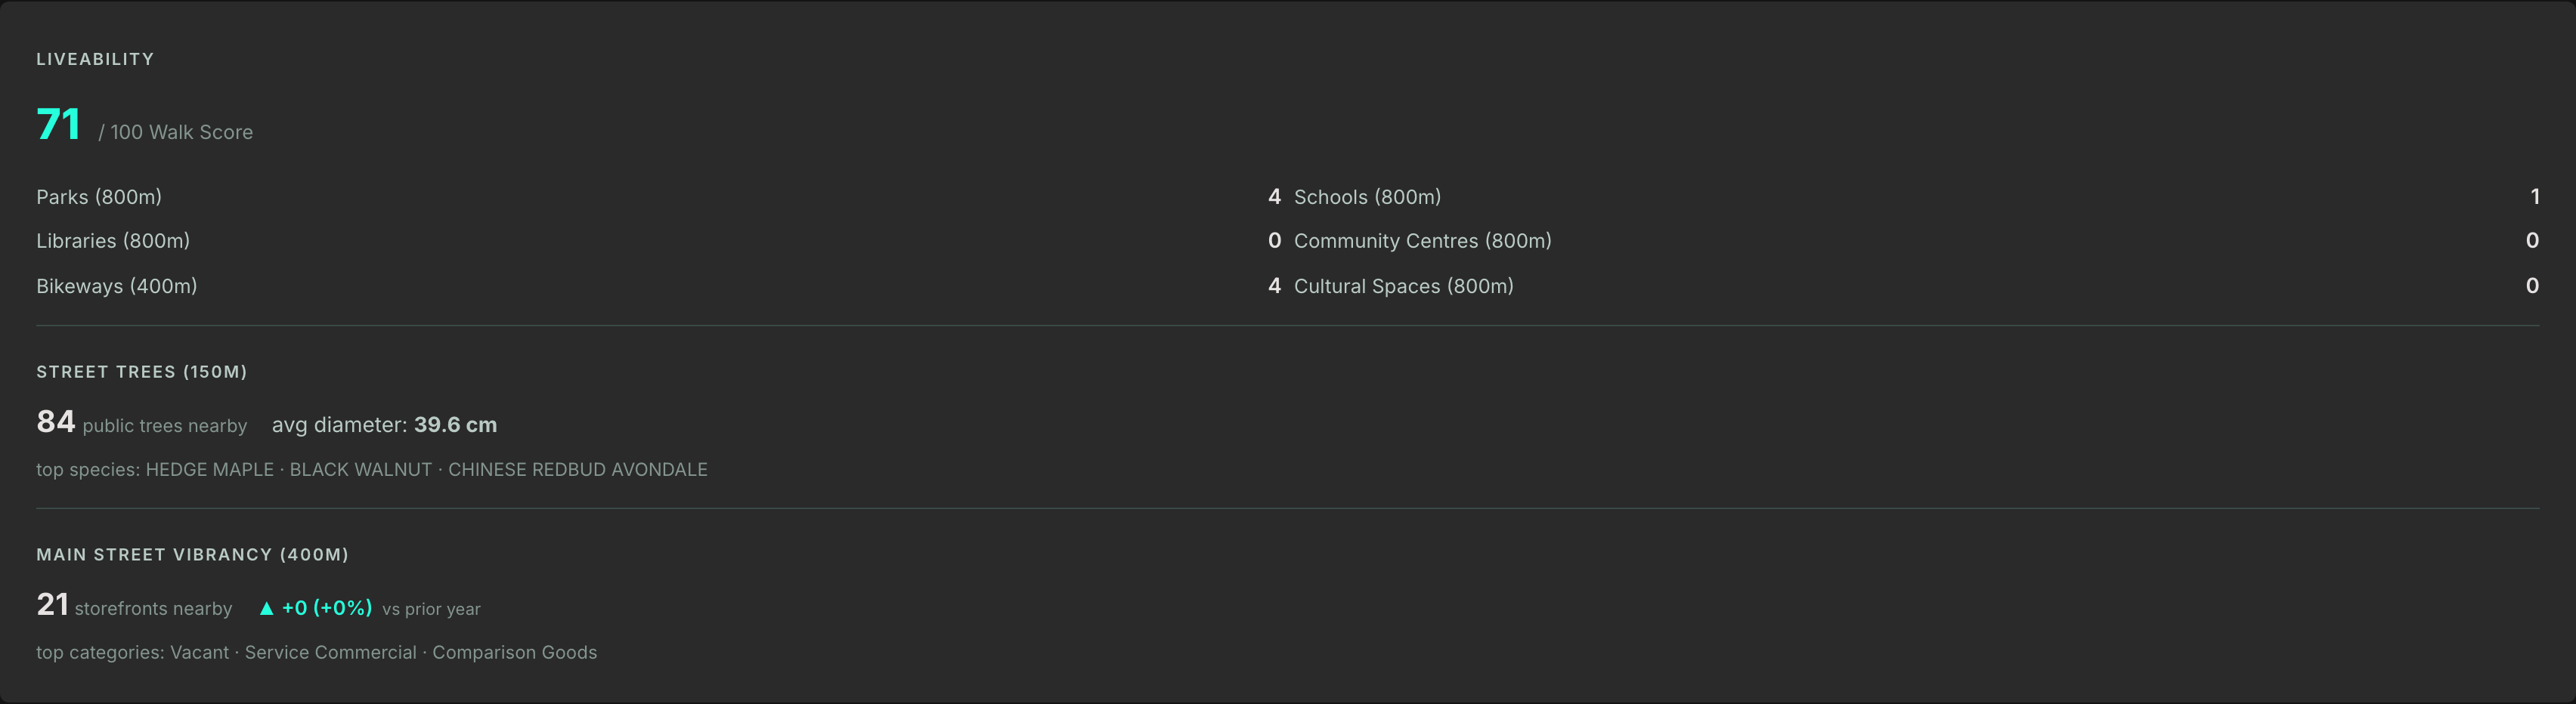
Liveability, trees & storefronts
Walk Score from real nearby counts: parks, schools, libraries, bikeways, cultural spaces, community centres. Plus street-tree canopy (species, age, diameter), storefront mix, and non-market housing within 500m — from Vancouver's public tree register and storefront dataset.
Plain-English AI summary
Every property comes with a full narrative written by Claude — covering the valuation, redevelopment case, risk profile, and recommendations you can paste straight into a client email. Plus an interactive chat: ask any question about the property and get an answer grounded in the property's own data.

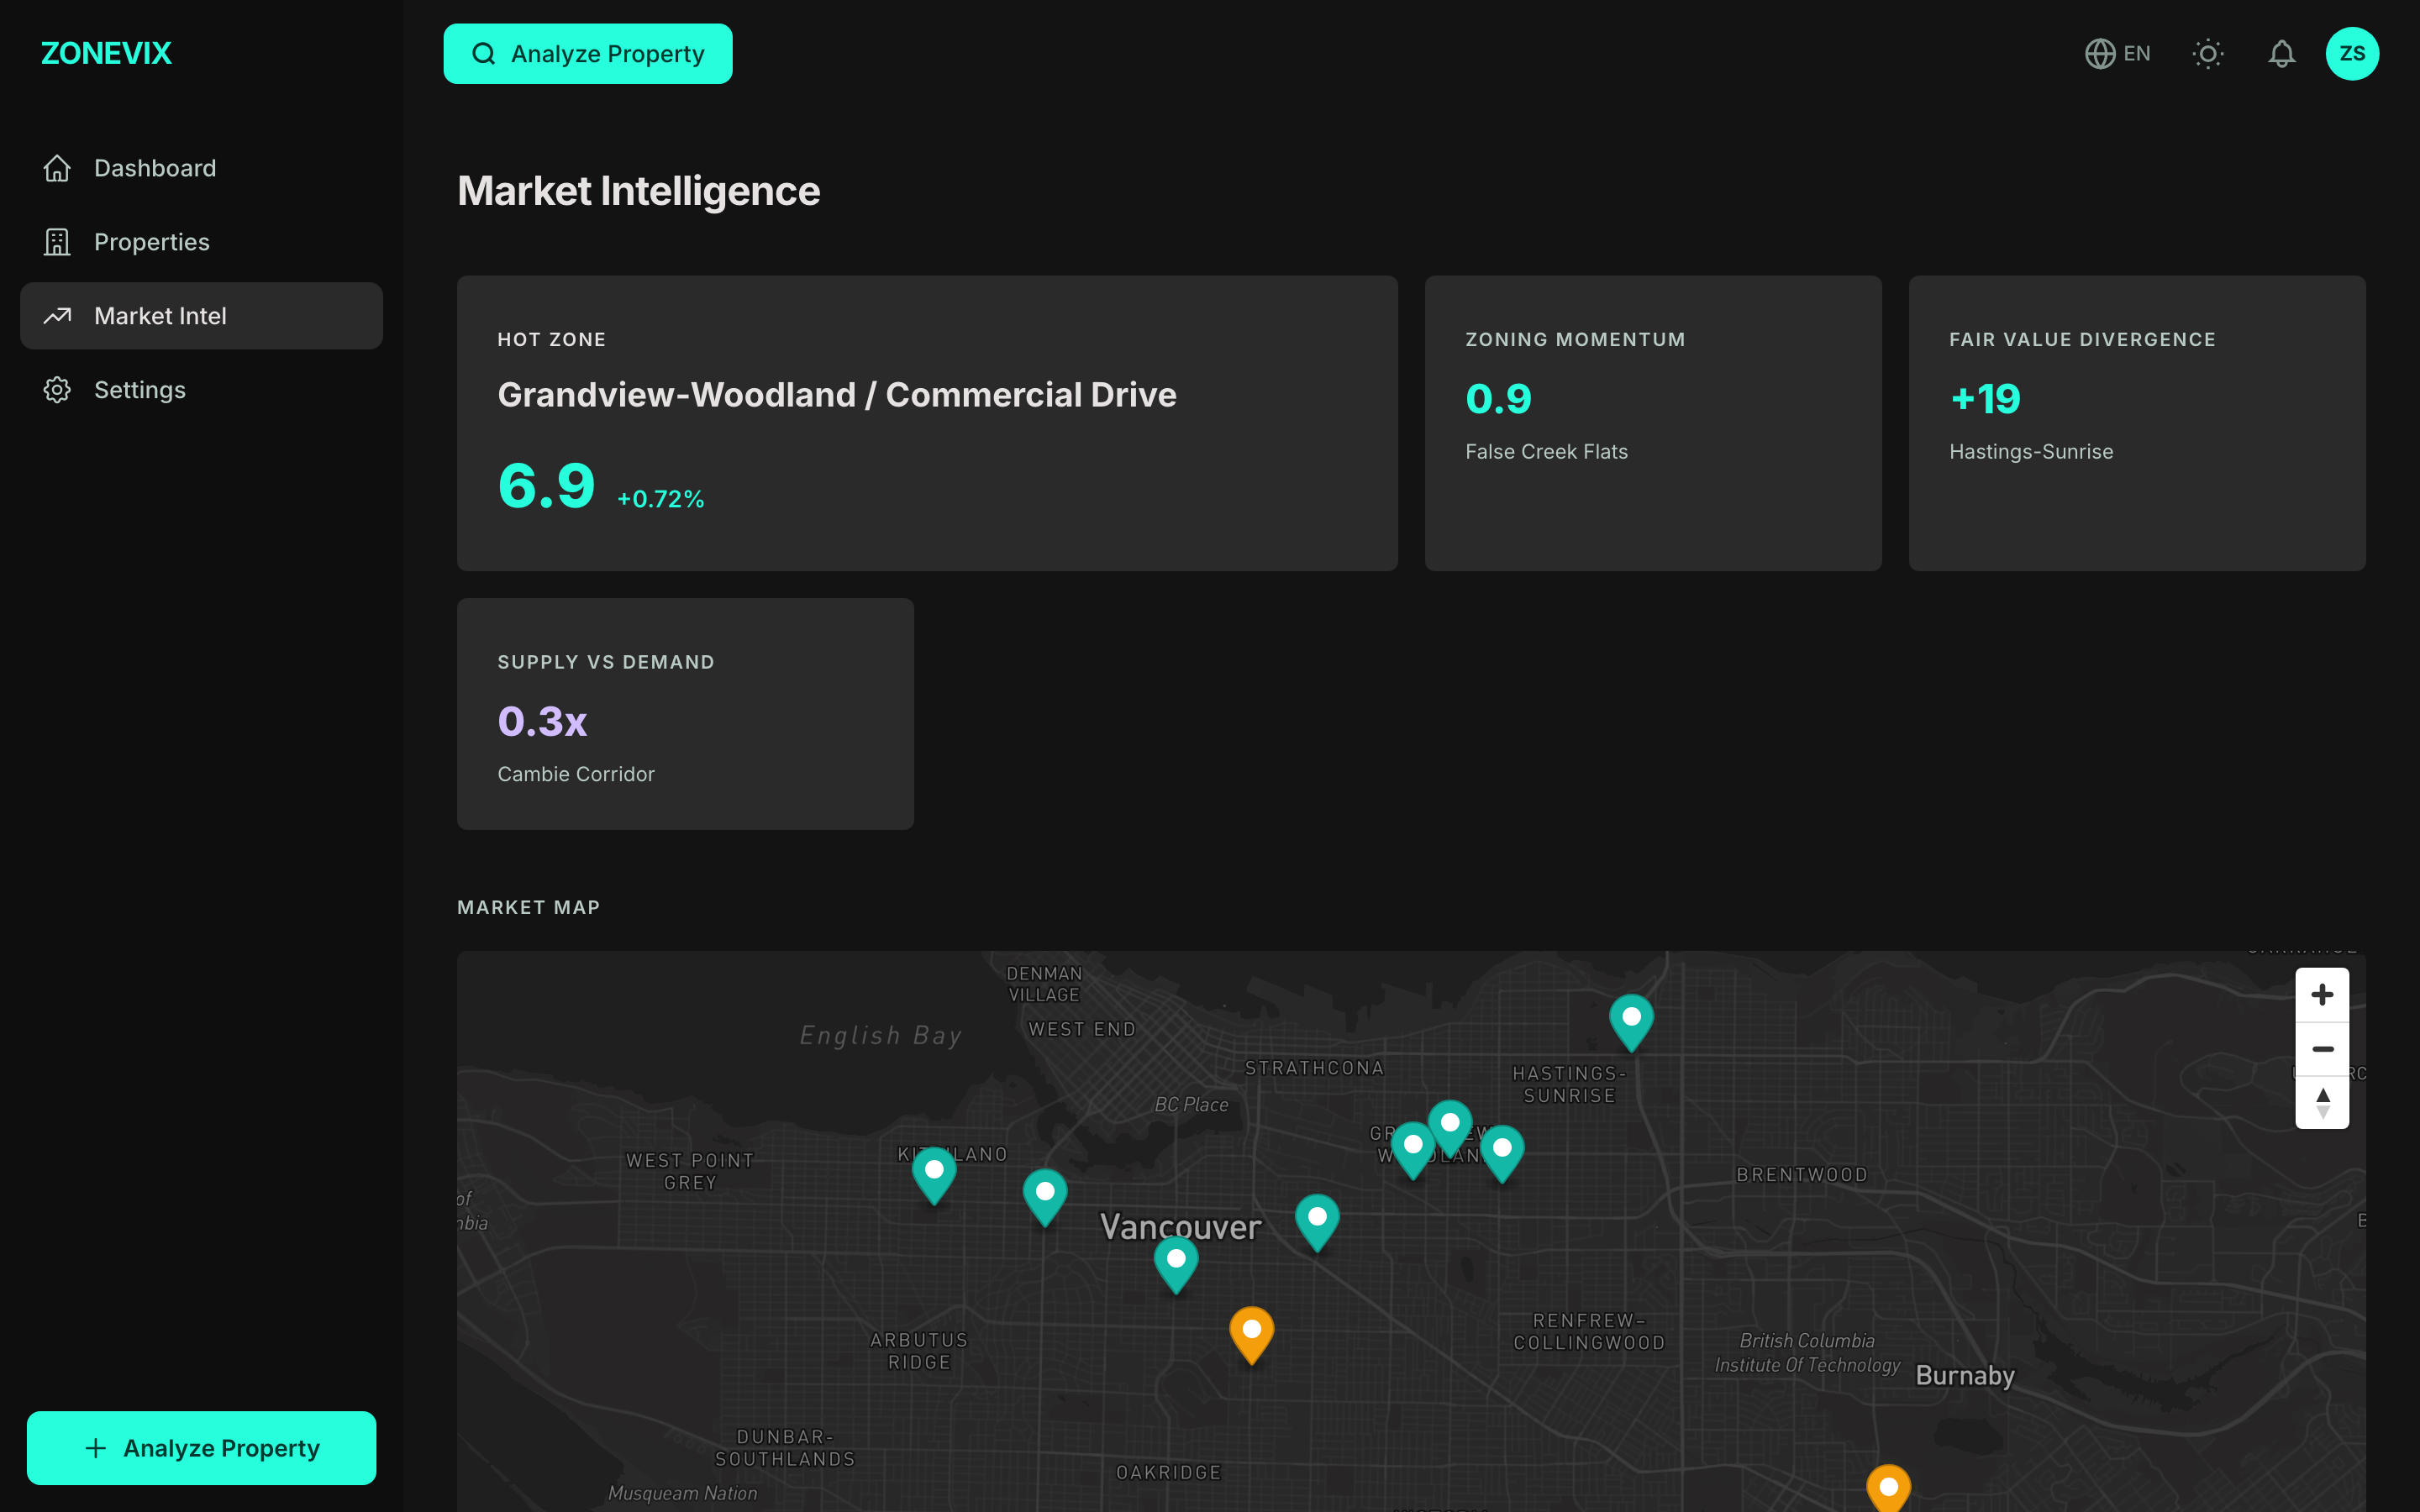
Market intelligence
Citywide Market Map showing hot zones, zoning momentum, fair value divergence, and supply vs demand — live, across every Vancouver neighborhood. Spot where the action is before it hits the MLS.
Who it's for
Built for professionals who move on data.
For Realtors
Walk into every listing with the full story: fair value, redevelopment angles, neighborhood momentum, and AI recommendations you can hand to clients. Close faster by showing more than comparables.
For Investors
Find hidden value before the market prices it in. Filter neighborhoods by policy momentum, spot assembly candidates via tie-line detection, and stress-test offers with hypothetical listing mode.
For Small Developers
Scan candidate lots with real FSR, DCL, and subdivision rules pre-computed. Cut the weeks of manual zoning research before you ever put pencil to paper on a pro forma.
Pricing
Built for one closed deal to pay for the whole year.
Start free. Upgrade only when Zonevix is already saving you hours every week.
Free
Try Zonevix on a few real properties before you commit.
- 5 property analyses, no expiry
- Full BC Assessment, zoning & parcel data
- Interactive map + Street View gallery
- Plain-English AI summary
Solo
For individual realtors and active buyers.
Billed monthly
- 30 analyses per month
- Everything in Free
- AI chat — ask anything about a property
- Save and tag properties to your portfolio
- Email support
Pro
For investors, teams, and serious deal-finders.
Billed monthly
- 150 analyses per month
- Everything in Solo
- Market Intelligence — citywide hot zones
- Hypothetical offers — model "what if I paid X"
- Assembly candidate detection
- PDF export of any property brief
Team
For brokerages and small development firms.
Billed monthly
- Unlimited analyses
- Up to 5 team seats
- Everything in Pro
- White-label PDF reports
- Priority support (4h response)
- Early access to new features
All plans include real Vancouver Open Data. No credit card required to start. Cancel anytime.
Start seeing Vancouver properties differently.
- Sign up free and analyze any Vancouver property in under a minute.
- 5 free analyses, no credit card needed.
- Real data. Real decisions. Start typing an address.